Trend reversal patterns are combinations of elements of a graph of a change in the value of an exchange asset over a specific time interval. They are used to predict future prices according to past data.
The view that the future cannot be predicted has a basis for existence. Geopolitical factors change the course of exchange history so that expectations are replaced by collapse. But we must hope for a positive result.

Introduction
Exchange assets are:
- Shares and bonds of companies;
- The goods are oil, gas and metals; coffee and sugar; gold, silver and platinum;
- Currency;
- Futures;
- Options.
Trend - a tendency to rise or fall. The value of traded items is constantly changing depending on the demand for the purchase and the offer for sale. During the day, the course may soar on rumors and fall on the news.
The archives of the exchange store data on the value of the asset reached in each trading session at the beginning of the trading period and at the end. The user can request information through the terminal and display it in the form of a graph with a time interval, for example, a minute or five minutes, an hour or a day; week or month.
Predicting future price behavior based on historical data is the purpose of technical analysis of charts that allows you to detect a trading signal in the intricacies of candles or bars.
The most obvious trend reversal patterns, indicating a forthcoming take-off or impending trend decline, allow the player to plan trading strategies for a short period for speculation or for a long interval for investment.
Child of an uptrend
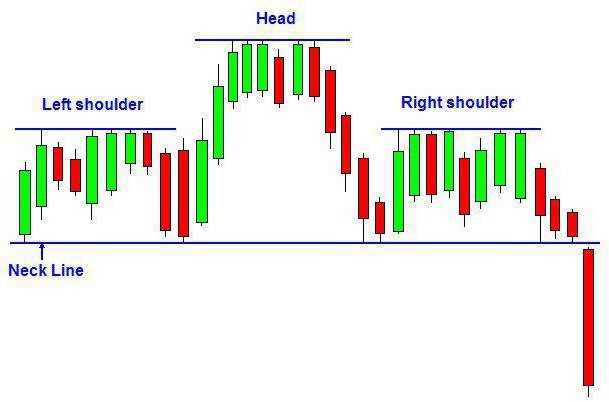
“Head and shoulders” - begins to form during a growth trend, and ends when a trend reverses. The contour consists of three peaks - low extreme and medium high display. The contour drawn through the points of minimum values in the valleys between the left and middle peaks and between the middle and right peaks is called the support line. After the first decline, the price hits support and bounces up, forming a shoulder and starting to draw a head. The second decline to the support line with subsequent reflection completes the formation of the head and begins drawing the right shoulder. When the support line is broken at the stage of the right shoulder, a trading signal appears about a trend change - a drop in value.
In addition to the banal analysis of the graphic figure, it is necessary to consider:
- the target price of the asset is the amount of value that the asset will take after the construction of the right shoulder is completed;
- traded volumes - the amount of goods or shares sold changes during the course of trading; if at the site of completing the drawing of the right shoulder the volumes increase several times in comparison with the volumes of the previous intervals, then this is a signal to a sharp drop in the value of the asset;
- the nature of the support line - if the minimum of the second depression is less than the minimum of the first depression, then there is a high probability of a bearish trend - a fall and satisfaction of demand for the asset.
Caucasus before the eyes
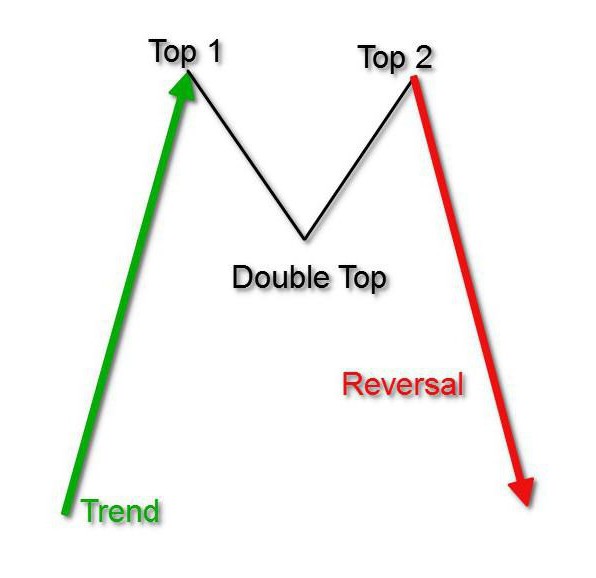
The following figure recalls the poet Lermontov. He who watched the sunrise from Mount Mashuk at five in the morning admired the double pinkish beauty of Elbrus. On the asset charts, a similar contour is found periodically - a double top.
And the element also resembles the McDonald's logo - the letter “M”.
A configuration is formed on a growing trend and with strong resistance. The price twice tries to break through resistance, first on a trend, the second time on a rebound from support. But with strong resistance goes down. With the breakdown of the support line, the trend reverses to decline.
Here you also need to carefully evaluate sales volumes. While the volumes are small, fluctuations promise a "sideways" and the possibility of continuing the growing trend. With a sharp increase in volumes, the forecast for a trend change approaches 100%.
But how will the trend change, what will it be - a deep correction or a global change of direction? Where will the traded asset go? These questions can be answered by calculating the target price. We find the difference between the value of the resistance line and the minimum in the depression opposite it. From the breakdown point of support, we postpone this difference down. This will be the level of the target price, in the absence of force majeure.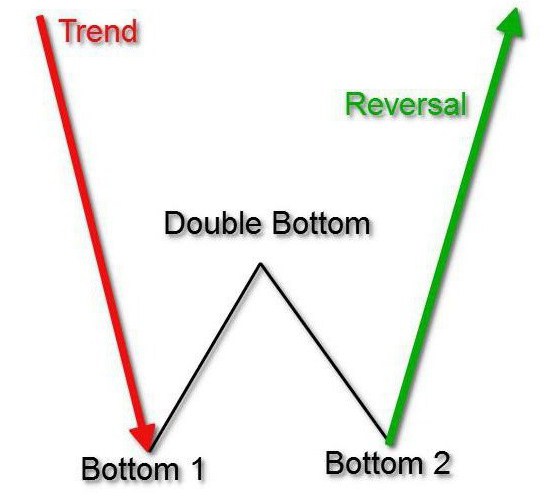
Immersion depth
Mankind is accustomed to advertising slogans so much that it perceives them as a weather cataclysm: with stoic indifference. But these are not traders. Dry trading statistics players color calls "The stock has reached its goal. The second bottom is a gift. ” Yes, there is a “double bottom” in technical analysis.
The figure is so called because the letter “M” is turned upside down. Peaks become bottom. The procedure for calculating the target price when changing the course is similar to the order for the “double top”. It is only necessary to swap the lines of support and resistance.
The author talks about generally accepted terminology. But in the trading environment it is not forbidden to come up with your own names. For example, the "double bottom" outlines very closely resembles the constellation Cassiopeia.
Big Top Trading
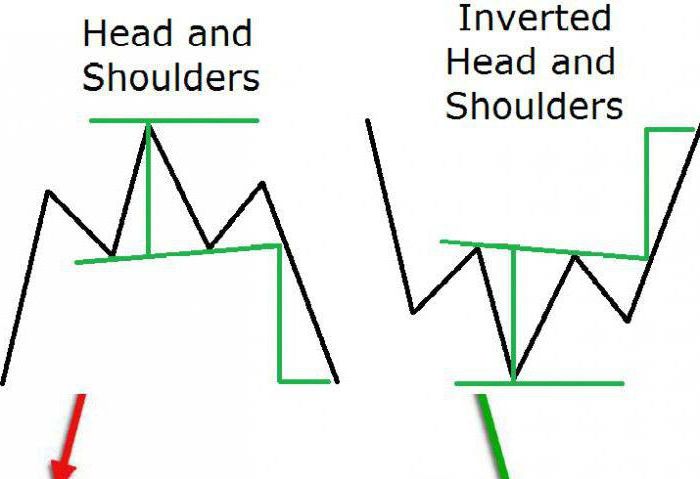
In the word form “trend reversal patterns” - the keyword “reversal”. Therefore, the observational masters of technical analysis identified the combination of “inverted head and shoulders” on the graph. The element is similar to the considered "head and shoulders", just the opposite. Accordingly, where there was support, a resistance line became. Where there was resistance, there was a support line. If the “head and shoulders” speaks of a bearish trend, then its inverted namesake indicates a bullish trend.
The need to correlate the direction of the price movement and the traded volumes remains for this chart configuration.
Extra remove
Trend reversal patterns are not always formed in their pure form. You should clearly cut off the noise, apply indicators and oscillators, and, in general, think with your own head, and not blindly follow the advisers.
Of course, each trader has his own concept of noise. For some, noise is deals that fly out of the corridor. For some, noise is a hole in the graph. There are citizens who consider minute charts to be noise because it is difficult to make a speculatively profitable decision for minutes.
But you should look at the charts at all intervals to understand the psychology of sellers and buyers.
And the breaks in the schedule do not go unnoticed and necessarily close, you just have to be patient.
Near and far
You can apply technical analysis figures to build a forecast on any time frames. Both intra-speculators and long-term investors have successfully conquered the stock market using support and resistance, volumes and breakdown points.

After training on the charts of actively traded issuers, the so-called “blue chips,” everyone can beautifully reset the deposit, and 5% of the players even increase their finances at the expense of the main crowd. A person enters the market and becomes there alternately either seller or buyer. It is important to buy on “loyas” and sell on “highs”. But where these magic points are, each player determines independently.
There are a variety of advisers, copying deals, robots for trading on the exchange. Think, if these robots were truly so successful, the developers would sell a fabulously profitable tool. Of course they would not. We would sit quietly and pump finance from stock bins. But these developers have well studied the psychology of people and realized that human greed and passion for freebies are their ally. And if the player does not earn a robot, it means that the robot is used incorrectly.

Dry residue
The trader builds trading strategies based on the theory and practice of trade. Technical analysis, elements and combinations of graphs:
- train observation;
- develop imagination;
- increase self-esteem;
- provide food for the mind;
- unexpectedly suggest how you can take your free time.
Exchange trading - work, which side do not look. The productivity of labor depends on the timeliness and correctness of the use of certain tools, including trend reversal patterns.
The small article does not convey all the wealth of the theory of technical analysis. Love a book - a source of knowledge, read, multiply useful knowledge. Success and luck accompany those who work.